Project Management General Template
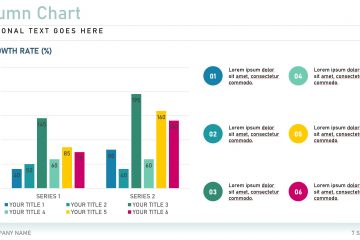
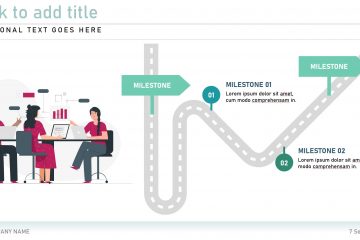
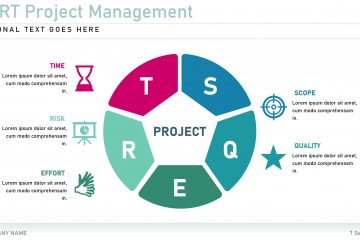
Project management is the way a person or business organises and manages resources that are necessary to complete a specific project. Use an editable diagram from the Project Management General presentation template to visually represent your own process.