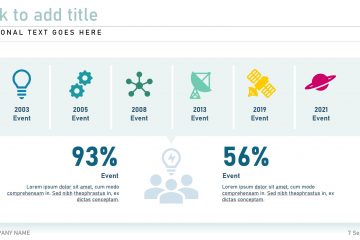
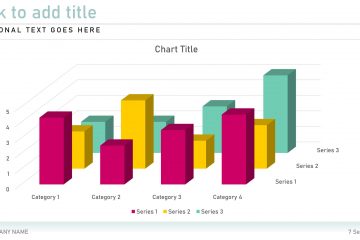
Health and Medicine General Infographic Template
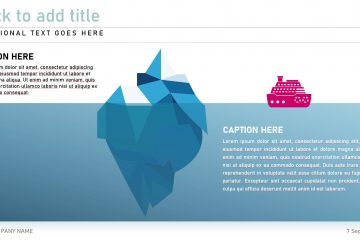
Use editable infographics from the General Infographic presentation template to add flair to your next health or medicine related proposal or presentation.
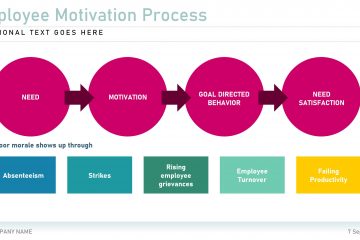
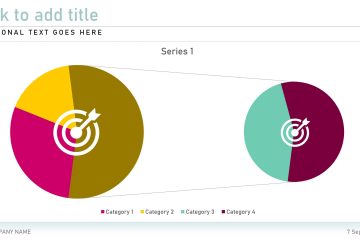
Smart graphics can be used to illustrate complex ideas in simpler visual-oriented diagrams and structures. All the elements in the Smart Graphics Infographic presentation template can be edited to suit your project and business needs.
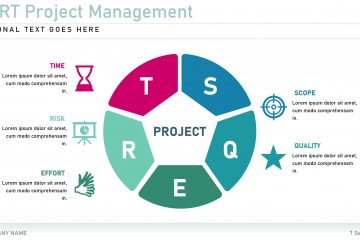
SCRUM is an agile approach to project management that breaks a product down into smaller tasks and places them on a list called a backlog. Tasks are taken from the backlog in the order they need to be completed and given to teams who work to get the job done Read more…
Decision trees are decision support tools that use a tree-like graph or model of decisions and their possible consequences including chance event outcomes resource costs and utility. Find your perfect editable problem-solving tree in the Decision Tree presentation template.
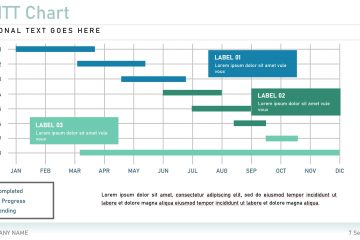
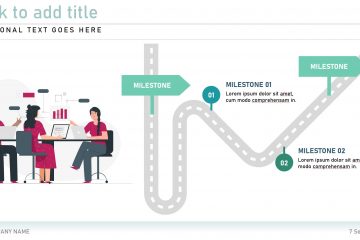
Find the right infographic elements to illustrate either the ongoing or the future route to success for your next project proposal or new business venture using editable elements from the Roadmap Infographic presentation template.
Strategic planning consists of analysing your business and setting realistic goals and objectives to propel your business into a success story. Find editable strategic planning-related diagrams and infographics in the Strategic planning presentation template.
Use the Restaurant Startup presentation template to bring your restaurant or food service ideas to life. Include menu options and signature dishes to your presentation to show what will set your startup apart from the rest.
The World Maps Infographic presentation template contains several world map visuals that you can use to pinpoint specific locations or to add data to relevant areas on the map.
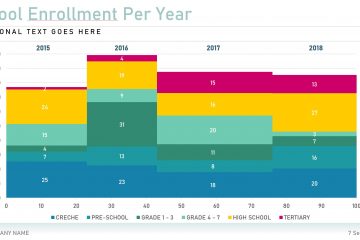
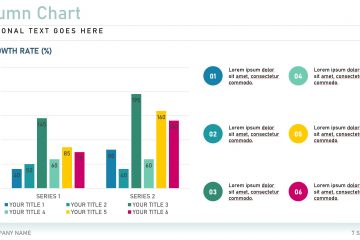
Table graphs are visual representations generally used to organise information to show patterns and relationships. Researchers and scientists often use tables and graphs to report findings from their research. Edit a diagram from the Table Graphs presentation template to fit in with your project.
Pricing tables should communicate information clearly and precisely and expose as many features as possible to make it as easy and as intuitive as possible for a user to make the best choice when choosing a new product or service. Make your pricing table as informative as possible by using Read more…