Business Concepts Business Plan Infographic Template
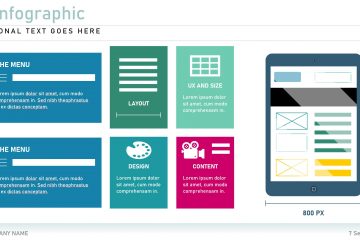
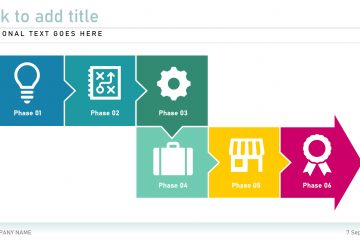
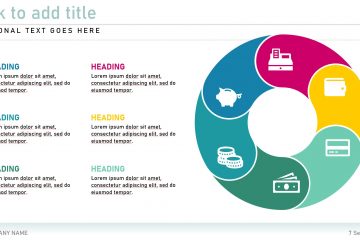
Communicate your dream to potential investors by making use of this editable Business Plan presentation template. Modify existing elements and charts to suit your individual needs.
Budgeting deals with the expectation of revenues that a business wants to achieve for a future period whereas forecasting approximates revenues that will be achieved in a future period. Find gold in an editable diagram from the Budget Forecasting presentation template.
Edit a product roadmap diagram from the Product Roadmap presentation template to create a high-level visual summary that maps out the vision and direction of your product offering over time.
Use this editable ADKAR Business Concept presentation template to illustrate the five tangible and concrete outcomes that people need to achieve for lasting change: awareness desire knowledge ability and reinforcement.
The Memory Infographic presentation template contains memory and brain related infographics to help you visualise medical or general information in your relevant proposal.
Illustrate the set of activities that your business performs in order to deliver a valuable product or service by using an editable diagram from the Value Chain presentation template.
Pie charts are circular statistical graphics that are divided into slices to illustrate numerical proportion. The size of each ‘slice’ is proportional to the quantity it represents. Use an editable pie chart from the Pie Chart presentation template or draw inspiration from it to create your own.
Reach your company’s goals and milestones by means of proper planning and communication. This fully editable Goals Infographic presentation template will help you to set realistic goals by the use of diagrams and and visual timelines.
Use one of the Supply Chain presentation template’s editable diagrams to illustrate the network of all the individuals organisations resources activities and technology involved in the creation and eventual sale of a product.
Use an editable diagram from the Mekko Chart presentation template to visualise categorical data over a pair of variables in your next business or project presentation. In a Mekko Chart both axes are variable with a percentage scale that determines both the width and height of each segment.