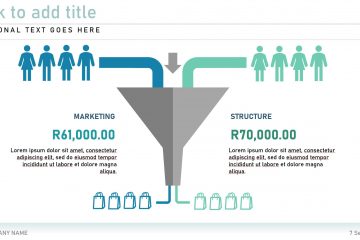
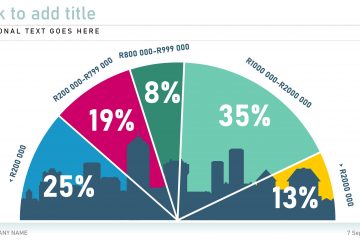
Health and Medicine Memory Infographic Template
The Memory Infographic presentation template contains memory and brain related infographics to help you visualise medical or general information in your relevant proposal.
Make education and learning a visual and fun experience by using editable elements from the Education and Learning Infographic presentation template to better illustrate complex ideas.
Table graphs are visual representations generally used to organise information to show patterns and relationships. Researchers and scientists often use tables and graphs to report findings from their research. Edit a diagram from the Table Graphs presentation template to fit in with your project.
Use the Restaurant Startup presentation template to bring your restaurant or food service ideas to life. Include menu options and signature dishes to your presentation to show what will set your startup apart from the rest.
Use topic related infographics and diagrams to add flair to your next ecology or nature related project or business presentation. The Ecology and Nature Infographic presentation template contains a variety of editable diagrams to best communicate your green ideas.
Risk management is the process of identifying assessing and controlling threats to an organisation’s capital and earnings. Visualise the proses in your next presentation by making use of a editable diagram or graphic from the Risk Management presentation template.
Fishbone or Ishikawa diagrams are cause-and-effect diagrams that help businesses to track down potential reasons for imperfections variations defects or failures. Edit yours from the Fishbone Cause and Effect presentation template collection.
Budgeting deals with the expectation of revenues that a business wants to achieve for a future period whereas forecasting approximates revenues that will be achieved in a future period. Find gold in an editable diagram from the Budget Forecasting presentation template.
Pricing tables should communicate information clearly and precisely and expose as many features as possible to make it as easy and as intuitive as possible for a user to make the best choice when choosing a new product or service. Make your pricing table as informative as possible by using Read more…
Decision trees are decision support tools that use a tree-like graph or model of decisions and their possible consequences including chance event outcomes resource costs and utility. Find your perfect editable problem-solving tree in the Decision Tree presentation template.