Data Visualisation Elements Business Infographic Template
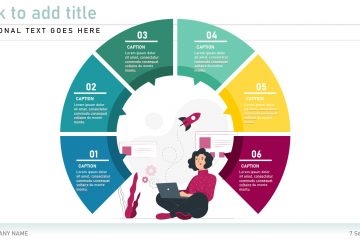
Use editable data visualisation elements and graphics from the Business Infographic presentation template to add substance to your next business proposal or new business plan.
Use editable data visualisation elements and graphics from the Business Infographic presentation template to add substance to your next business proposal or new business plan.
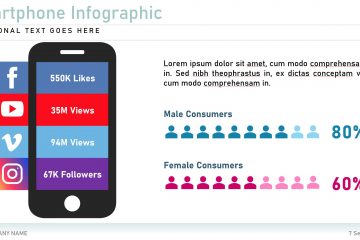
Facebook Twitter Youtube and more The Social Media Infographic presentation template contains social media-related infographic elements for you to edit and add to your next technology and communication or marketing pitch.
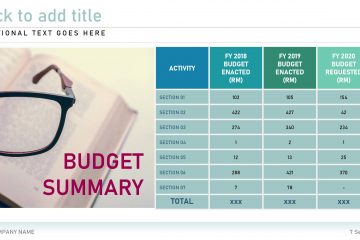
Budgeting deals with the expectation of revenues that a business wants to achieve for a future period whereas forecasting approximates revenues that will be achieved in a future period. Find gold in an editable diagram from the Budget Forecasting presentation template.
Strategic planning consists of analysing your business and setting realistic goals and objectives to propel your business into a success story. Find editable strategic planning-related diagrams and infographics in the Strategic planning presentation template.
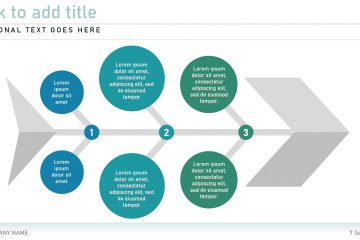
Fishbone or Ishikawa diagrams are cause-and-effect diagrams that help businesses to track down potential reasons for imperfections variations defects or failures. Edit yours from the Fishbone Cause and Effect presentation template collection.
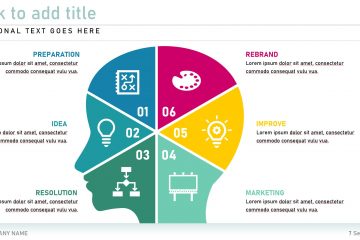
The Memory Infographic presentation template contains memory and brain related infographics to help you visualise medical or general information in your relevant proposal.
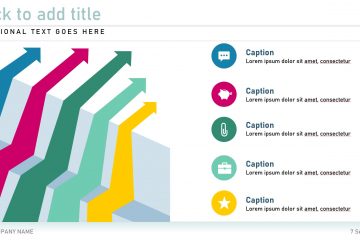
Most business plans and project proposals involve several complicated steps that are required to be arranged into easier to segments that are easier to understand. Use an editable arrow infographic from the Arrow Infographic presentation template to best explain your business or project direction.
Use the Restaurant Startup presentation template to bring your restaurant or food service ideas to life. Include menu options and signature dishes to your presentation to show what will set your startup apart from the rest.
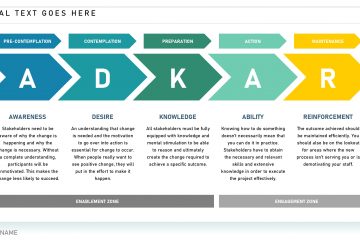
Use this editable ADKAR Business Concept presentation template to illustrate the five tangible and concrete outcomes that people need to achieve for lasting change: awareness desire knowledge ability and reinforcement.
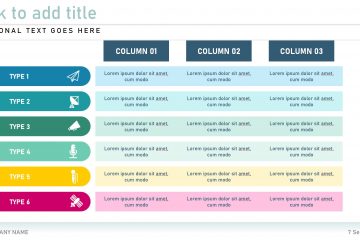
Table graphs are visual representations generally used to organise information to show patterns and relationships. Researchers and scientists often use tables and graphs to report findings from their research. Edit a diagram from the Table Graphs presentation template to fit in with your project.