Business Concepts SWOT Analysis Infographic Template
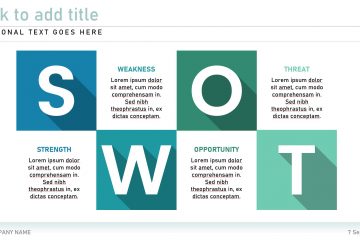
A SWOT (strengths weaknesses opportunities and threats analysis) analysis is a framework mostly used for identifying and analysing both internal and external factors that can potentially impact the viability of a project. Use an infographic from the SWOT Analysis Infographic presentation template to add great substance to your next proposal.