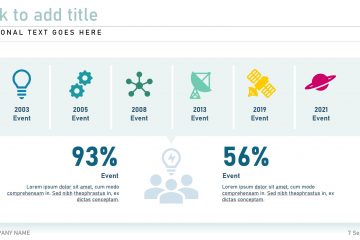
Project Management Timeline Template
The Project Management Timeline presentation template will assist you in visually explaining the timelines that your business aim to meet in order to meet specific project goals and objectives.
The Project Management Timeline presentation template will assist you in visually explaining the timelines that your business aim to meet in order to meet specific project goals and objectives.
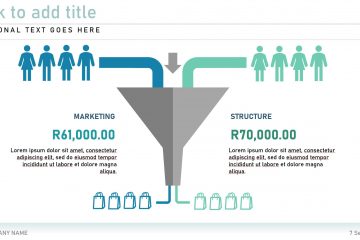
Funnels are often used to represent stages in a sales or marketing processes. They can also be useful in identifying potential problem areas in an organisation’s sales or marketing processes. Use an editable funnel from the Funnels General presentation template to add value to your next business presentation.
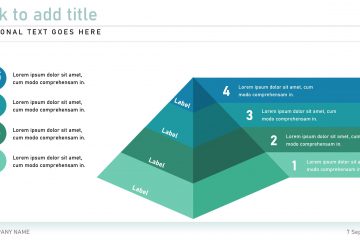
Visualise data in a hierarchical structure and depict foundation-based relationships in your business using editable diagrams from this Pyramid Diagram Infographic presentation template.
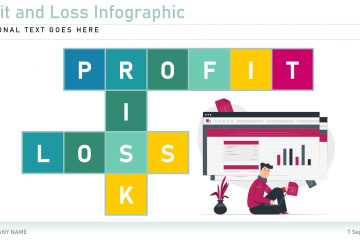
The profit and loss statement is a financial statement that abridge all revenues costs and expenses that a business incurred during a certain specified period. Create a visual representation for your next presentation by making use of a editable diagram from the Profit and Loss presentation template.
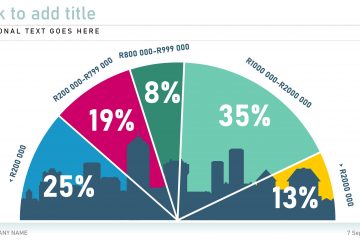
Own or rent? Get your property-related venture off the ground with visual aid from the Property General Infographic presentation template. This template contains housing and property-related diagrams and infographics that will definitely add flair to your proposal.
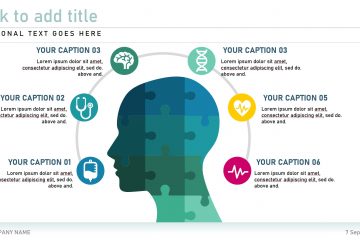
Use editable infographics from the General Infographic presentation template to add flair to your next health or medicine related proposal or presentation.
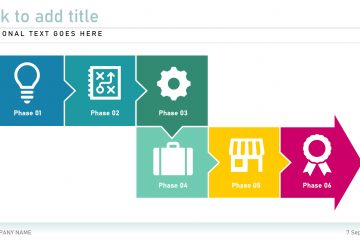
The fully editable Processes Infographic presentation template was created to help you illustrate how different processes lead into and from one another to provide your business or project with a roadmap to success.
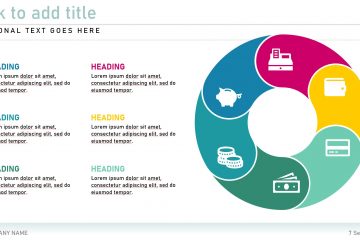
The fully editable Cycles Infographic presentation template was created to help you illustrate how different processes lead into and from one another to provide your business or project with a roadmap to success.
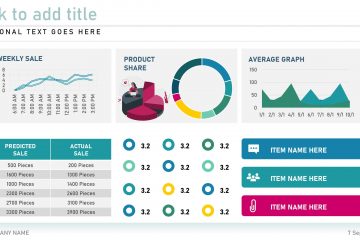
The Dashboard Infographic presentation template contains examples of content dashboards that are encountered in the technology and communication sector – especially in apps or websites. Edit one in the template or use elements from more than one in order to create the dashboard perfect for your next project.
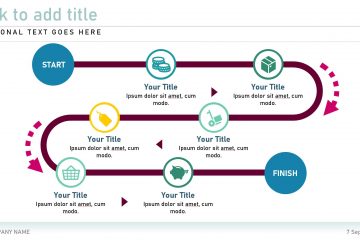
Find the right infographic elements to illustrate either the ongoing or the future route to success for your next project proposal or new business venture using editable elements from the Roadmap Infographic presentation template.